8.2. Communicating with the DUT
There are two types of DUTs that can be made: tethered or standalone DUTs. A tethered DUT is where a host computer (or just host) must send transactions to the DUT to bringup a program. This differs from a standalone DUT that can bringup itself (has its own bootrom, loads programs itself, etc). An example of a tethered DUT is a Chipyard simulation where the host loads the test program into the DUTs memory and signals to the DUT that the program is ready to run. An example of a standalone DUT is a Chipyard simulation where a program can be loaded from an SDCard out of reset. In this section, we mainly describe how to communicate to tethered DUTs.
There are two ways the host (otherwise known as the outside world) can communicate with a tethered Chipyard DUT:
Using the Tethered Serial Interface (TSI) or the Debug Module Interface (DMI) with the Front-End Server (FESVR) to communicate with the DUT
Using the JTAG interface with OpenOCD and GDB to communicate with the DUT
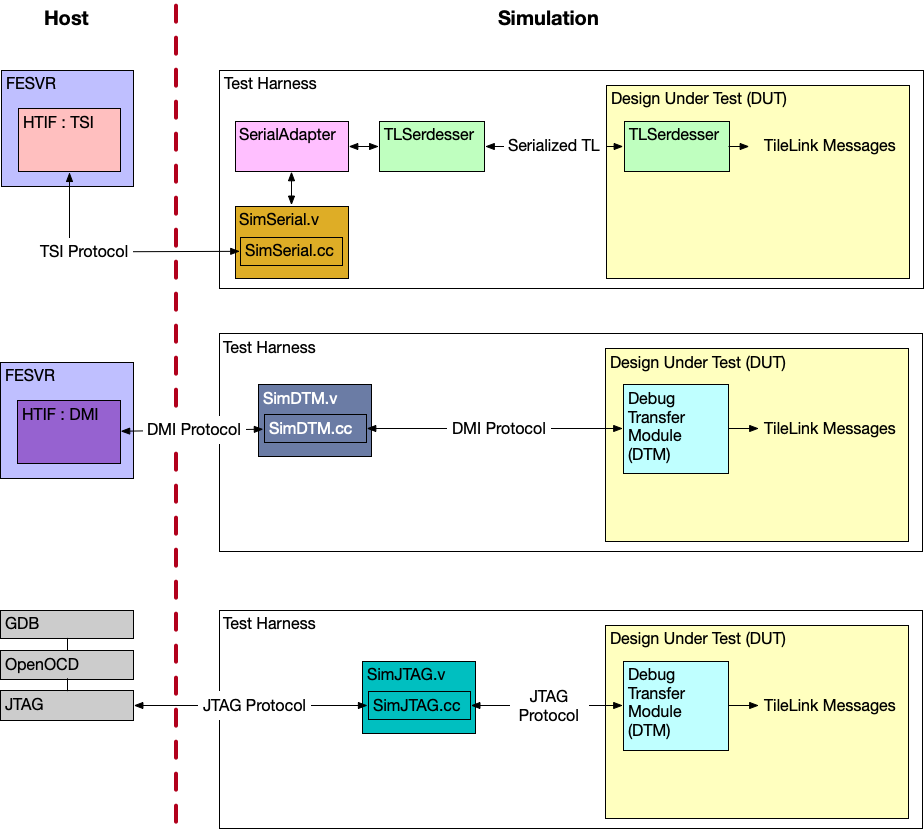
The following picture shows a block diagram view of all the supported communication mechanisms split between the host and the simulation.
8.2.1. Using the Tethered Serial Interface (TSI) or the Debug Module Interface (DMI)
If you are using TSI or DMI to communicate with the DUT, you are using the Front-End Server (FESVR) to facilitate communication between the host and the DUT.
8.2.1.1. Primer on the Front-End Server (FESVR)
FESVR is a C++ library that manages communication between a host machine and a RISC-V DUT. For debugging, it provides a simple API to reset, send messages, and load/run programs on a DUT. It also emulates peripheral devices. It can be incorporated with simulators (VCS, Verilator, FireSim), or used in a bringup sequence for a taped out chip.
Specifically, FESVR uses the Host Target Interface (HTIF), a communication protocol, to speak with the DUT. HTIF is a non-standard Berkeley protocol that uses a FIFO non-blocking interface to communicate with the DUT. It defines a protocol where you can read/write memory, load/start/stop the program, and more. Both TSI and DMI implement this HTIF protocol differently in order to communicate with the DUT.
8.2.1.2. Using the Tethered Serial Interface (TSI)
By default, Chipyard uses the Tethered Serial Interface (TSI) to communicate with the DUT.
TSI protocol is an implementation of HTIF that is used to send commands to the RISC-V DUT.
These TSI commands are simple R/W commands that are able to access the DUT’s memory space.
During simulation, the host sends TSI commands to a simulation stub in the test harness called SimTSI
(C++ class) that resides in a SimTSI Verilog module (both are located in the generators/testchipip
project).
This SimTSI Verilog module then sends the TSI command recieved by the simulation stub
to an adapter that converts the TSI command into a TileLink request.
This conversion is done by the TSIToTileLink module (located in the generators/testchipip project).
After the transaction is converted to TileLink, the TLSerdesser (located in generators/testchipip) serializes the
transaction and sends it to the chip (this TLSerdesser is sometimes also referred to as a digital serial-link or SerDes).
Once the serialized transaction is received on the chip, it is deserialized and masters a TileLink bus on the chip
which handles the request.
In simulation, FESVR resets the DUT, writes into memory the test program, and indicates to the DUT to start the program
through an interrupt (see Chipyard Boot Process).
Using TSI is currently the fastest mechanism to communicate with the DUT in simulation (compared to DMI/JTAG) and is also used by FireSim.
8.2.1.3. Using the Debug Module Interface (DMI)
Another option to interface with the DUT is to use the Debug Module Interface (DMI).
Similar to TSI, the DMI protocol is an implementation of HTIF.
In order to communicate with the DUT with the DMI protocol, the DUT needs to contain a Debug Transfer Module (DTM).
The DTM is given in the RISC-V Debug Specification
and is responsible for managing communication between the DUT and whatever lives on the other side of the DMI (in this case FESVR).
This is implemented in the Rocket Chip Subsystem by having the HasPeripheryDebug and HasPeripheryDebugModuleImp traits.
During simulation, the host sends DMI commands to a
simulation stub called SimDTM (C++ class) that resides in a SimDTM Verilog module
(both are located in the generators/rocket-chip project). This SimDTM Verilog module then
sends the DMI command recieved by the simulation stub into the DUT which then converts the DMI
command into a TileLink request. This conversion is done by the DTM named DebugModule in the generators/rocket-chip project.
When the DTM receives the program to load, it starts to write the binary byte-wise into memory.
This is considerably slower than the TSI protocol communication pipeline (i.e. SimTSI/TSIToTileLink/TileLink)
which directly writes the program binary to memory.
8.2.1.4. Starting the TSI or DMI Simulation
All default Chipyard configurations use TSI to communicate between the simulation and the simulated SoC/DUT. Hence, when running a software RTL simulation, as is indicated in the Software RTL Simulation section, you are in-fact using TSI to communicate with the DUT. As a reminder, to run a software RTL simulation, run:
cd sims/verilator
# or
cd sims/vcs

make CONFIG=RocketConfig run-asm-tests
If you would like to build and simulate a Chipyard configuration with a DTM configured for DMI communication, then you must tie-off the serial-link interface, and instantiate the SimDTM.
// ucb.bar/chipyard/generators/chipyard/src/main/scala/config/PeripheralDeviceConfigs.scala
class dmiRocketConfig extends Config(
  new chipyard.harness.WithSerialTLTiedOff ++                    // don't attach anything to serial-tl
  new chipyard.config.WithDMIDTM ++                              // have debug module expose a clocked DMI port
  new freechips.rocketchip.rocket.WithNHugeCores(1) ++
  new chipyard.config.AbstractConfig)
Then you can run simulations with the new DMI-enabled top-level and test-harness.
cd sims/verilator
# or
cd sims/vcs

make CONFIG=dmiRocketConfig run-asm-tests
8.2.2. Using the JTAG Interface
Another way to interface with the DUT is to use JTAG.
Similar to the Using the Debug Module Interface (DMI) section, in order to use the JTAG protocol,
the DUT needs to contain a Debug Transfer Module (DTM) configured to use JTAG instead of DMI.
Once the JTAG port is exposed, the host can communicate over JTAG to the DUT through a simulation stub
called SimJTAG (C++ class) that resides in a SimJTAG Verilog module (both reside in the generators/rocket-chip project).
This simulation stub creates a socket that OpenOCD and GDB can connect to when the simulation is running.
The default Chipyard designs instantiate the DTM configured to use JTAG (i.e. RocketConfig).
Note
As mentioned, default Chipyard designs are enabled with JTAG. However, they also use TSI/Serialized-TL with FESVR in case the JTAG interface isn’t used. This allows users to choose how to communicate with the DUT (use TSI or JTAG).
8.2.2.1. Debugging with JTAG + GDB
This section provides detailed instructions for using GNU debugger (GDB) to debug RISC-V programs running on the emulator, similar to debugging with Spike.
8.2.2.1.1. Generating the Remote Bit-Bang (RBB) Emulator
The objective of this section is to use GNU debugger to debug RISC-V programs running on the emulator in the same fashion as in Spike.
For that we need to add a Remote Bit-Bang client to the emulator. We can do so by extending our Config
with JtagDTMSystem, which will add a DebugTransportModuleJTAG to the DUT and connect a SimJTAG
module in the Test Harness. This will allow OpenOCD to interface with the emulator, and GDB can interface
with OpenOCD. In the following example we add this Config alteration to
src/main/scala/system/Configs.scala:
class DefaultConfigRBB extends Config(
  new WithJtagDTMSystem ++ new WithNBigCores(1) ++ new WithCoherentBusTopology ++ new BaseConfig)

class QuadCoreConfigRBB extends Config(
  new WithJtagDTMSystem ++ new WithNBigCores(4) ++ new WithCoherentBusTopology ++ new BaseConfig)
To build the emulator with DefaultConfigRBB configuration we use the command:
rocket-chip$ cd emulator
emulator$ CONFIG=freechips.rocketchip.system.DefaultConfigRBB make
We can also build a debug version capable of generating VCD waveforms using the command:
emulator$ CONFIG=freechips.rocketchip.system.DefaultConfigRBB make debug
By default the emulator is generated under the name
emulator-freechips.rocketchip.system-DefaultConfigRBB in the first case and
emulator-freechips.rocketchip.system-DefaultConfigRBB-debug in the second.
8.2.2.1.2. Compiling and executing a custom program using the emulator
We suppose that helloworld is our program. You can use crt.S, syscalls.c, and the linker script
test.ld to construct your own program (see
riscv-tests). Note that test.ld loads the program at
0x80000000 so you will need -mcmodel=medany (see
The RISC-V Code Models).
char text[] = "Vafgehpgvba frgf jnag gb or serr!";

// Don't use the stack, because sp isn't set up.
volatile int wait = 1;

int main()
{
    while (wait)
        ;

    // Doesn't actually go on the stack, because there are lots of GPRs.
    int i = 0;
    while (text[i]) {
        char lower = text[i] | 32;
        if (lower >= 'a' && lower <= 'm')
            text[i] += 13;
        else if (lower > 'm' && lower <= 'z')
            text[i] -= 13;
        i++;
    }

    while (!wait)
        ;
}
First, we can test if this program executes correctly in the simpler emulator (non-RBB) before debugging:
$ ./emulator-freechips.rocketchip.system-DefaultConfig helloworld
Additional verbose information (clock cycle, pc, instruction being executed) can be printed:
$ ./emulator-freechips.rocketchip.system-DefaultConfig +verbose helloworld 2>&1 | spike-dasm
VCD output files can be obtained using the -debug version of the emulator and are specified using -v or
--vcd=FILE arguments. A detailed log file of all executed instructions can also be obtained from the emulator:
$ ./emulator-freechips.rocketchip.system-DefaultConfig-debug +verbose -v output.vcd helloworld 2>&1 | spike-dasm > output.log
Note
Generated VCD waveforms and execution log files can be very voluminous depending on the size of the .elf file (i.e. code size + debugging symbols).
Note
The time it takes the emulator to load your program depends on executable size. Stripping the .elf executable
will unsurprisingly make it run faster. For this you can use $RISCV/bin/riscv64-unknown-elf-strip tool to
reduce the size. This is good for accelerating your simulation but not for debugging.
Warning
The HTIF communication interface between our system and the emulator relies on tohost and fromhost
symbols to communicate. If you try to run a totally stripped executable on the emulator, you may get:
$ ./emulator-freechips.rocketchip.system-DefaultConfig totally-stripped-helloworld
This emulator compiled with JTAG Remote Bitbang client. To enable, use +jtag_rbb_enable=1.
Listening on port 46529
warning: tohost and fromhost symbols not in ELF; can't communicate with target
To resolve this, we need to strip all the .elf executable but keep tohost and fromhost symbols:
$ riscv64-unknown-elf-strip -s -Kfromhost -Ktohost helloworld
More details on the GNU strip tool can be found here.
The interest of this step is to make sure your program executes well. To perform debugging you need the original unstripped version, as explained in the following steps.
8.2.2.1.3. Launch the emulator
First, do not forget to compile your program with -g -Og flags to provide debugging support.
We can then launch the Remote Bit-Bang enabled emulator with:
./emulator-freechips.rocketchip.system-DefaultConfigRBB +jtag_rbb_enable=1 --rbb-port=9823 helloworld
Note
You can also use the emulator-freechips.rocketchip.system-DefaultConfigRBB-debug version instead if you
would like to generate VCD waveforms.
Note
If the argument --rbb-port is not passed, a default free TCP port on your computer will be chosen randomly.
Note
When debugging with GDB, the .elf file is not actually loaded by the FESVR. In contrast with Spike, it must
be loaded from GDB as explained in step 5. So the helloworld argument may be replaced by any dummy name.
8.2.2.1.4. Launch OpenOCD
You will need a RISC-V Enabled OpenOCD binary. This is installed with rocket-tools in $(RISCV)/bin/openocd,
or can be compiled manually from riscv-openocd. OpenOCD requires a configuration file, in which we define the RBB
port we will use, which is in our case 9823.
interface remote_bitbang
remote_bitbang_host localhost
remote_bitbang_port 9823

set _CHIPNAME riscv
jtag newtap $_CHIPNAME cpu -irlen 5

set _TARGETNAME $_CHIPNAME.cpu
target create $_TARGETNAME riscv -chain-position $_TARGETNAME

gdb_report_data_abort enable

init
halt
Then we launch OpenOCD in another terminal using the command:
$(RISCV)/bin/openocd -f ./cemulator.cfg
Note
A -d flag can be added to the command to show further debug information.
8.2.2.1.5. Launch GDB
In another terminal launch GDB and point to the elf file you would like to load then run it with the debugger
(in this example, helloworld):
$ riscv64-unknown-elf-gdb helloworld
Compared to Spike, the C Emulator is very slow, so several problems may be encountered due to timeouts between
issuing commands and response from the emulator. To solve this problem, we increase the timeout with the GDB
set remotetimeout command.
After that we load our program by performing a load command. This automatically sets the $PC to the
_start symbol in our .elf file:
(gdb) set remotetimeout 2000
(gdb) target remote localhost:3333
Remote debugging using localhost:3333
0x0000000000010050 in ?? ()
(gdb) load
Loading section .text.init, size 0x2cc lma 0x80000000
Loading section .tohost, size 0x48 lma 0x80001000
Loading section .text, size 0x98c lma 0x80001048
Loading section .rodata, size 0x158 lma 0x800019d4
Loading section .rodata.str1.8, size 0x20 lma 0x80001b30
Loading section .data, size 0x22 lma 0x80001b50
Loading section .sdata, size 0x4 lma 0x80001b74
Start address 0x80000000, load size 3646
Transfer rate: 40 bytes/sec, 520 bytes/write.
Now we can proceed as with Spike, debugging works in a similar way:
(gdb) print wait
$1 = 1
(gdb) print wait=0
$2 = 0
(gdb) print text
$3 = "Vafgehpgvba frgf jnag gb or serr!"
(gdb) c
Continuing.

^C
Program received signal SIGINT, Interrupt.
main (argc=0, argv=<optimized out>) at src/main.c:33
33      while (!wait)
(gdb) print wait
$4 = 0
(gdb) print text
$5 = "Instruction sets want to be free!"
For more information on GDB debugging, refer to:
8.2.3. Example Test Chip Bringup Communication
8.2.3.1. Intro to Typical Chipyard Test Chip
Most, if not all, Chipyard configurations are tethered using TSI (over a serial-link) and have access to external memory through an AXI port (backing AXI memory). The following image shows the DUT with these set of default signals:
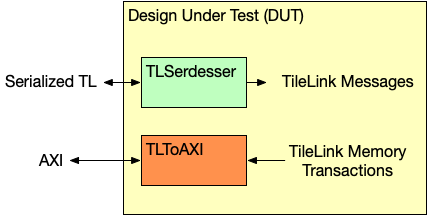
In this setup, the serial-link is connected to the TSI/FESVR peripherals while the AXI port is connected
to a simulated AXI memory.
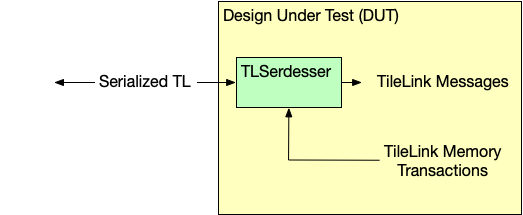
However, AXI ports tend to have many signals, and thus wires, associated with them so instead of creating an AXI port off the DUT,
one can send the memory transactions over the bi-directional serial-link (TLSerdesser) so that the main
interface to the DUT is the serial-link (which has comparatively less signals than an AXI port).
This new setup (shown below) is a typical Chipyard test chip setup:
8.2.3.2. Simulation Setup of the Example Test Chip
The standard test-chip bringup procedure tethers the chip to a FPGA config with serialized tilelink.
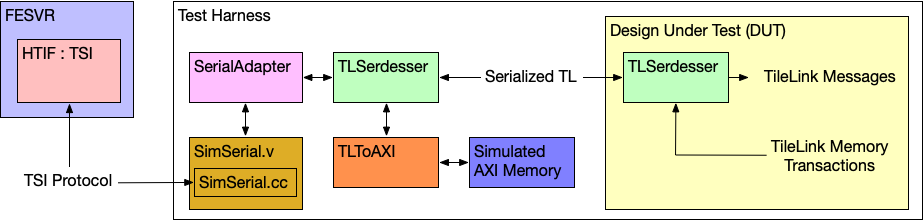
The entire bringup procedure can be simulated using the Multi-ChipTop simulation feature, where
one ChipTop is the design-to-be-taped-out, while the other is the FPGA bringup design.
This system can be generated and simulated with the following example configuration, which marries
a ChipLikeRocketConfig (the design to be taped-out) with the ChipBringupHostConfig (the FPGA
bringup design).
// ucb.bar/chipyard/generators/chipyard/src/main/scala/config/ChipConfigs.scala
class TetheredChipLikeRocketConfig extends Config(
  new chipyard.harness.WithAbsoluteFreqHarnessClockInstantiator ++   // use absolute freqs for sims in the harness
  new chipyard.harness.WithMultiChipSerialTL(0, 1) ++                // connect the serial-tl ports of the chips together
  new chipyard.harness.WithMultiChip(0, new ChipLikeRocketConfig) ++ // ChipTop0 is the design-to-be-taped-out
  new chipyard.harness.WithMultiChip(1, new ChipBringupHostConfig))  // ChipTop1 is the bringup design